Preface
Optical spectroscopy is a science that refers to the analysis of interactions between electromagnetic (EM) radiation (i. e. light) and matter. Optical spectrometry is the means to measure, qualify, and quantify electromagnetic (EM) radiation. However, many reports cite spectrometry and spectroscopy terminologies interchangeably.
Brief History of Optical Spectroscopy
Optical spectroscopy as a subject came into prominence as an offshoot of quantum mechanics studies. Like many scientific inventions, the studies on spectroscopy originate in research works on the characteristics of light. From ancient Egyptian and Greek times to the Middle Ages and till the Renaissance-era classical thinking about light was prevalent among scientists. The 17th century saw more academic analysis of light, and crude optical apparatus began to emerge.
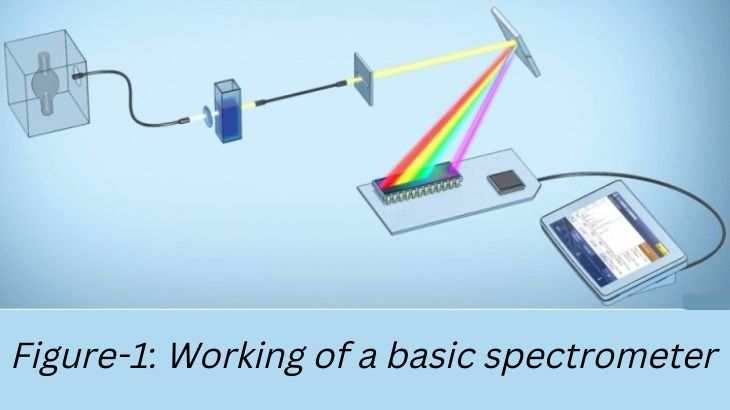
However, Sir Isaac Newton achieved significant headway in studying light during his Opticks experiments in which he examined sunlight. In 1666, Newton observed that directing white light through a prism leads it to disperse into colored components, and a reverse-oriented prism recombines them back into white light. Newton termed the color band as a "spectrum." Efforts to further enhance the invention of Newton continued in the following years and decades. Eventually, in 1802 English scientist William Hyde Wollaston succeeded in designing the first spectrometer. This essay aims at shedding light on various aspects of optical spectroscopy and review some optical spectrometry instruments.
Types of Optical Spectroscopy
According to the nature of optical interaction and properties of the material under examination, optical spectroscopy can be summarized into four broad categories. They are as follows.
Optical atomic spectroscopy is a subcategory of atomic spectroscopy (or atomic spectrometry). Its use is to measure ultraviolet, visible, or infrared light yielded during the interaction of electromagnetic energy with atoms of chemical elements. The technique relies on the phenomenon that electrons within an atom having different energy levels absorb or emit light at a specific, distinct wavelength during their transition to higher-energy levels or lower-energy levels, respectively. An instrument measures the absorbed or emitted light energy that corresponds to the amount of element under analysis. Some widely used optical atomic spectroscopy instruments are Atomic Absorption Spectrometers (AAS), Inductively Coupled Plasma Optical Emission Spectrometer (ICP-OES), and X-ray fluorescence spectrometers (XRF Analyzers).
Atomic Absorption Spectrometer (AAS):
AAS are widely used to determine elemental concentrations in a sample. A standard atomic absorption spectrometer comprises six core constituent assemblies: a sample introduction system, light source, atomizer, monochromator/ polychromator, detector, and data recorder.
The Sample introduction system transfers liquid or solid samples as aerosol (or Solid) into the atomizer as required by a specific atomizer. The atomizer might be any one of flame atomizers, electrothermal atomizers (Graphite furnaces), glow-discharge atomizers, hydride-generating atomizers, or cold vapor atomizers. The atomizer uses controlled temperature to transform the sample aerosol into a gaseous cloud of ground-state atoms. A light source radiates light at atom-specific wavelengths. As the light passes through the atom cloud, each atom absorbs light energy (photons) at unique wavelengths according to its electronic structure. Due to energy absorption, electrons in atoms transition to higher energy states from their ground state. The detector measures the absorbed light that is, according to The Beer-Lambert law, directly proportional to the sum of absorbing atoms. So the concentration of elements is known from the absorbed light.
Before detection, the light travels through a monochromator/polychromator. The monochromator/polychromator removes background interference of light and selects only specific wavelengths of light. In the end, a recorder converts detector signals into suitable formats from which humans can extract information and derive conclusions.
")
Inductively Coupled Plasma Optical Emission Spectrometer (ICP-OES):
ICP-OES falls within the optical emission spectroscopy group of instruments. On many occasions, ICP-OES refers to inductively coupled plasma Atomic emission spectroscopy (ICP-AES) as synonymous. It is an instrument that analyses elemental composition within a sample up to trace level concentration. Because of faster analysis, simultaneous detection, over-the-top sensitivity, multi-element feature, higher matrix allowance, high sample throughput, remarkable stability, and extended linear dynamic range (LDR), ICP-OES has found wide acceptance as the preferred choice of inorganic analysis. ICP-OES measures light intensity at characteristic wavelengths that excited atoms or ions emit as their electrons transition from higher to lower energy levels while easing.
A modern ICP-OES consists of six modules: a sample injector system, a high-power plasma torch, a radio frequency (RF) generator circuit, wavelength selector optics, a detector, a signal processor, and a data recorder. Generally, ICP-OES works with liquid samples. The sample injector transforms liquid samples into an aerosol through nebulization. Solid sample analysis is possible if there are systems to convert them into vapor. The aerosol or vapor phase sample is placed into the plasma torch. A plasma torch is a quartz tube through which plasma gas argon flows. Some ICP-OES may use nitrogen or a mixed gas as plasma gas.
The RF generator produces high-frequency alternating current and feeds it to an induction coil. The induction coil applies the RF field to the quartz torch. The RF field around the quartz tube produces an alternating magnetic field that accelerates electrons in a circular path within the torch. Moving electrons collide with argon atoms inside the torch and cause the ionization of argon atoms. Oscillating gaseous ions within the magnetic field develop into hot stable plasma inside the torch. Lightening in nature is an illustration of a plasma-like condition. The sun is another example of plasma gas. The plasma temperature might reach up to 10,000°C, which is sufficient to achieve atomization, excitation, and ionization for most elements. When the excited atoms return to their ground state and electrons drop from higher to lower energy levels, they liberate light energy at characteristic wavelengths.
A characteristic wavelength relates to the types of atoms (or ions) and energy levels between electrons. According to the Beer-Lambert law, the intensity of liberated light is proportional to the number of atoms and ions changing states. Wavelength selector optics picks up the released light spectrum and separate individual wavelengths. The detector marks each wavelength with its intensity. Each wavelength represents an element, and intensities represent respective concentrations. A signal processor transforms the detected values into electrical signals and transmits them to a data recorder. The recorder then displays data in appropriate forms for humans to read, interpret and utilize.
X-ray fluorescence (XRF) spectrometer:
X-ray fluorescence (XRF) spectrometer is also known as an XRF analyzer. XRF spectrometer works according to the principle of wavelength-dispersive spectroscopy, which is a relatively non-destructive means of chemical analysis. The main components of an XRF spectrometer are the X-ray generator or X-ray source, optics, and detector.
X-ray operates in the 0.01 to 10 nm wavelength range of electromagnetic waves. X-rays can easily pass through matter, unlike usual electromagnetic (EM) radiation. X-ray interaction with matter produces fluorescence and scattering. Out of the total incident X-ray, a fraction will transmit through, a fraction will get absorbed, and the rest will scatter. The absorbed portion results in the emission of fluorescence X-rays radiation.
Scattering with energy loss is known as Compton scattering, and scattering without energy loss is Rayleigh scatter. Fluorescence and scattering rely on the X-ray radiation energy, the thickness, density, and chemical makeup of matter.
The working process of an XRF spectrometer involves ejecting electrons from the innermost shells of an atom. In atoms, electrons at various energy shells (orbitals) revolve around the nucleus. K-shell is the innermost orbit, followed by L-shell and M-shell, and so on. Electrons possess varying energy depending on the element they belong to and the shell they reside on. Binding energy bound shells to the nuclei. The X-ray source of an XRF spectrometer irradiates high energy, short wavelength, and high-frequency radiation stronger than the energy that couples electrons to an atom's nucleus. When an X-ray beam strikes a material, it excites atoms and, due to high energy, dislodges an electron to outer shells from the innermost shells. As a result, atoms lose stability. Atoms restore stability by filling vacant positions with electrons from higher energy shells, thus causing the radiation of fluorescent X-rays. Two particular electron shell orbitals of any element will always have the same energy difference. So, the energy of the emitted fluorescent X-rays will equal the energy difference between the two shells on which transitioning electrons reside. Therefore, the fluorescent X-ray radiation energy for each element will be unique. The unique fluorescent X-ray energy represents characteristic energy for a specific type of atom (atomic fingerprint). According to Moseley's law, fluorescent X-ray radiation identifies an element and the intensity of the same X-ray light tells the elemental quantity.
There are two types of XRF spectrometers energy dispersive XRF or EDXRF and wavelength dispersive XRF or WDXRF. WDXRF has a broader elemental range compared to EDXRF.
XRF analysis does not require touching and causes no harm to the sample. XRF spectrometer has wide use for determining the chemical composition and material characterization of alloys, fluids, powders, geological substances, rocks, ceramics, filter material, sediments, thin films, historical stuff, and the like.
Video: Optical Emission spectroscopy (OES) Explained
Scattering spectroscopy deals with the interaction of electromagnetic radiation (light) with chemical bonds within a substance. Analyte molecules within a material scatter incident light at particular wavelengths, incident angles, and polarization angles depending on their chemical structure. The technique reveals a detailed molecular composition of the material by measuring the amount of scattered light at different wavelengths. Also, it specifies constituent chemical groups within the target material.
Related reading
- An Informative Overview of Thermal Desorption (TD) Sample Introduction Technique for GC
- The Importance of Vacuum in Mass Spectroscopy
- General Technical Overview of Vacuum Ultraviolet Detector for Gas Chromatography – VUV Detector
- Technical Specifications of Gas Chromatograph with Flame Ionization Detector and Split/Splitless Inlet (GC with FID)